PrometheusでCiscoのL3SWの温度を取得する
夏なのでPrometheus SNMP ExporterでCisco Catalyst 3560CGの温度を取得してグラフにしてみた
概要
ふと部屋に置いてるCiscoのL3SW C3560CGを触ったところ、冬場と比べて明らかに温度が高くなっていた。
今後、夏になればさらに温度が上がることが予想されるため、Grafanaでサクッと筐体温度のグラフを作ろうとしたが、先日導入したPrometheus SNMP Exporterでは筐体温度が取得されていなかった。
そのため、いろいろ調査をしながらSNMP Exporterの設定を変更し、温度の監視ができるようにしてみる。
確認
まず、Catalyst 3560CGにsshでログインし、コマンドから温度を確認してみた。
c3560cg>show env all
SYSTEM TEMPERATURE is OK
System Temperature Value: 60 Degree Celsius
System Temperature State: GREEN
Yellow Threshold : 80 Degree Celsius
Red Threshold    : 90 Degree Celsius
SW  PID                 Serial#     Status           Sys Pwr  PoE Pwr  Watts
--  ------------------  ----------  ---------------  -------  -------  -----
 1  Built-in                                         Good


c3560cg>
(80℃になるまではState GREENと書いてあるが、本当にそんな熱い状態で運用していて大丈夫なんだろうか…)
次に、LinuxマシンからSNMPで温度が取得できるか確認してみる。
軽く調べてみたところ、CISCO-ENVMON-MIB::ciscoEnvMonTemperatureStatusTableに入っていそうだったので、以下のようにsnmpwalkしてみた。
$ snmpwalk -v2c -c XXXXXX 10.XXX.XXX.XXX 1.3.6.1.4.1.9.9.13.1.3
CISCO-ENVMON-MIB::ciscoEnvMonTemperatureStatusDescr.1004 = STRING: SW#1, Sensor#1, GREEN
CISCO-ENVMON-MIB::ciscoEnvMonTemperatureStatusValue.1004 = Gauge32: 60 degrees Celsius
CISCO-ENVMON-MIB::ciscoEnvMonTemperatureThreshold.1004 = INTEGER: 90 degrees Celsius
CISCO-ENVMON-MIB::ciscoEnvMonTemperatureLastShutdown.1004 = INTEGER: 0 degrees Celsius
CISCO-ENVMON-MIB::ciscoEnvMonTemperatureState.1004 = INTEGER: normal(1)
$
CISCO-ENVMON-MIB::ciscoEnvMonTemperatureStatusValue.1004(=.1.3.6.1.4.1.9.9.13.1.3.1.3.1004)が現在温度を示していることが確認できた。
実装
上記の結果を見ながら、SNMP Exporterの設定ファイル(snmp.yaml)を書き換えていく。
本来であれば、恐らくgeneratorを使うべきなのだが、環境構築が面倒臭かったため、今回は以下のYAMLを直にsnmp.yamlの下に追記した。
c3560cg:
  auth:
    community: XXXXXX
  walk:
  - 1.3.6.1.4.1.9.9.13.1.3.1
  metrics:
  - name: ciscoEnvMonTemperatureStatus
    oid: 1.3.6.1.4.1.9.9.13.1.3.1.6
    type: gauge
    indexes:
    - labelname: testpointIndex
      type: gauge
    lookups:
    - labelname: description
      labels:
      - testpointIndex
      oid: 1.3.6.1.4.1.9.9.13.1.3.1.2
      type: DisplayString
    - labelname: threshold
      labels:
      - testpointIndex
      oid: 1.3.6.1.4.1.9.9.13.1.3.1.4
      type: gauge
    enum_values:
      1: normal
      2: warning
      3: critical
      4: shutdown
      5: notPresent
      6: notFunctioning
  - name: ciscoEnvMonTemperatureValue
    oid: 1.3.6.1.4.1.9.9.13.1.3.1.3
    type: gauge
    indexes:
    - labelname: testpointIndex
      type: gauge
    lookups:
    - labelname: description
      labels:
      - testpointIndex
      oid: 1.3.6.1.4.1.9.9.13.1.3.1.2
      type: DisplayString
    - labelname: threshold
      labels:
      - testpointIndex
      oid: 1.3.6.1.4.1.9.9.13.1.3.1.4
      type: gauge
  - name: ciscoEnvMonTemperatureLastShutdown
    oid: 1.3.6.1.4.1.9.9.13.1.3.1.5
    type: gauge
    indexes:
    - labelname: testpointIndex
      type: gauge
    lookups:
    - labelname: description
      labels:
      - testpointIndex
      oid: 1.3.6.1.4.1.9.9.13.1.3.1.2
      type: DisplayString
    - labelname: threshold
      labels:
      - testpointIndex
      oid: 1.3.6.1.4.1.9.9.13.1.3.1.4
      type: gauge
今回対象にしているCatalyst 3560CGでは温度がインデックス1004の1つしか取得できないが、勉強を兼ねて複数のインデックスを持っている場合も動きそうな書き方をしてみた。(複数の温度が取れる機器を持っていないため未検証)
snmp.yamlに追記後、prometheus-snmp-exporterサービスを再起動して反映させる。
すると、以下のようにSNMP Exporterで温度が取得できるようになった。
# HELP ciscoEnvMonTemperatureLastShutdown
# TYPE ciscoEnvMonTemperatureLastShutdown gauge
ciscoEnvMonTemperatureLastShutdown{description="SW#1, Sensor#1, GREEN ",testpointIndex="1004",threshold="90"} 0
# HELP ciscoEnvMonTemperatureStatus
# TYPE ciscoEnvMonTemperatureStatus gauge
ciscoEnvMonTemperatureStatus{description="SW#1, Sensor#1, GREEN ",testpointIndex="1004",threshold="90"} 1
# HELP ciscoEnvMonTemperatureValue
# TYPE ciscoEnvMonTemperatureValue gauge
ciscoEnvMonTemperatureValue{description="SW#1, Sensor#1, GREEN ",testpointIndex="1004",threshold="90"} 59
# HELP snmp_scrape_duration_seconds Total SNMP time scrape took (walk and processing).
# TYPE snmp_scrape_duration_seconds gauge
snmp_scrape_duration_seconds 0.00547437
# HELP snmp_scrape_pdus_returned PDUs returned from walk.
# TYPE snmp_scrape_pdus_returned gauge
snmp_scrape_pdus_returned 5
# HELP snmp_scrape_walk_duration_seconds Time SNMP walk/bulkwalk took.
# TYPE snmp_scrape_walk_duration_seconds gauge
snmp_scrape_walk_duration_seconds 0.005385572
(頑張ってYAMLを書いてるうちに温度が1℃下がったが、ciscoEnvMonTemperatureValueが現在の筐体温度)
おまけ
CiscoのMIBをダウンロードしてUbuntuで翻訳させて表示させるメモ。
-
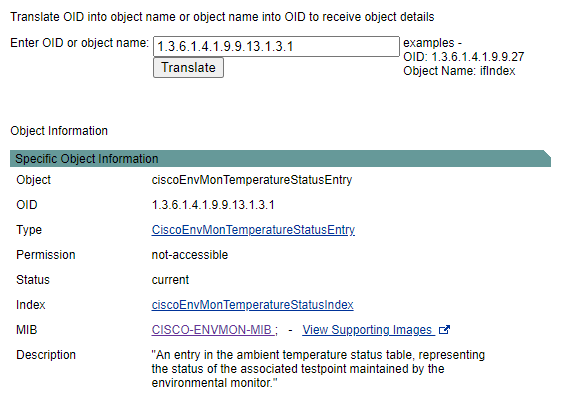
このサイトで翻訳したいMIBを入力してTranslateを押す。
https://snmp.cloudapps.cisco.com/Support/SNMP/do/BrowseOID.do -
出てきた画面でMIB欄の横にあるリンクをクリックする。
-
自分の欲しいSNMPバージョン(今回はVersion 2)のDownloadリンクにあるファイルをすべて取得する。
wget ftp://ftp.cisco.com/pub/mibs/v2/SNMPv2-SMI.my wget ftp://ftp.cisco.com/pub/mibs/v2/CISCO-SMI.my wget ftp://ftp.cisco.com/pub/mibs/v2/CISCO-ENVMON-MIB.my -
/usr/share/snmp/vendor/ciscoあたりに配置して、/etc/snmp/snmp.confのmibdirsに追記する。# As the snmp packages come without MIB files due to license reasons, loading # of MIBs is disabled by default. If you added the MIBs you can reenable # loading them by commenting out the following line. mibs all # If you want to globally change where snmp libraries, commands and daemons # look for MIBS, change the line below. Note you can set this for individual # tools with the -M option or MIBDIRS environment variable. # # mibdirs /usr/share/snmp/mibs:/usr/share/snmp/mibs/iana:/usr/share/snmp/mibs/ietf mibdirs /usr/share/snmp/mibs:/usr/share/snmp/mibs/iana:/usr/share/snmp/mibs/ietf:/usr/share/snmp/vendor/cisco -
snmptranslateを実行してテスト$ snmptranslate 1.3.6.1.4.1.9.9.13.1.3.1.3 CISCO-ENVMON-MIB::ciscoEnvMonTemperatureStatusValue